
Introduction to analyzing financial statements
At the Consonance Group, we recognize the challenges small organizations encounter in financial management. Deciphering and analyzing financial statements can be akin to navigating unfamiliar territory, especially without a full-time CFO. Rest assured; we are here to assist you in understanding the nuances of financial statement analysis, starting with horizontal and vertical analysis. In the upcoming articles, we will provide you with insights to make analysis and informed decisions for the financial well-being of your organization.
Nonprofits are unique because they distinguish themselves by prioritizing accountability over profitability. Financial statements help leaders of a nonprofit organization evaluate its financial performance and are crucial for securing the organization’s future well-being. This series of articles offers recommendations, diverging from the traditional focus on budget versus actual analysis, and introduces various alternative approaches to financial statement analysis.
Vertical and Horizontal Analysis
Various methods and analytical tools such as horizontal analysis, also known as trend analysis and vertical analysis can be employed to assess the financial robustness of a nonprofit entity. Conducting both vertical and horizontal analyses on the income statement, balance sheet, and cash flow statement over time provides a comprehensive overview of operational outcomes. This approach unveils the factors influencing an organization's performance and indicates its operational efficiency and profitability.
Horizontal Analysis
Horizontal analysis, or trend analysis, examines changes in financial statement items over time. It involves comparing one period, typically a month, quarter, or year, to another. For example, an organization might compare current-year expenses with those from the previous year. By tracking these trends, organizations gain valuable insights into overall performance and identify specific areas for improvement.
How to conduct a horizontal analysis
The period (month, quarter, or year) being used for comparison purposes is called the base period. Usually, the prior period is selected. For instance, let's say a company made $180,000 in revenue during the 3rd quarter and $150,000 in the 2nd quarter. If we compare the 3rd quarter revenue to the 2nd quarter, we consider the 2nd quarter numbers as the "Base Period," and the 3rd quarter numbers as the "Period of Analysis."
The period of comparison for horizontal analysis can be analyzed for absolute (dollar) and percent change against the base year. The absolute(dollar) change is found by taking the dollar amount in the base period and subtracting that from the period of analysis.
Dollar Change = Period of Analysis Amount – Base Period Amount ($30,000 = $180,000 - $150,000)
The percentage change is found by taking the dollar change, dividing by the base period amount, and then multiplying by 100.
Percent Change = (Dollar Change / Base period amount) x 100 (20%= ($30,000 / $150,000) x 100)
We recommend adopting a hybrid approach for conducting horizontal analysis, emphasizing thresholds for both dollar changes and percentages. For example, analyze variances that exceed either $5,000 or 10%. Management must establish these thresholds in alignment with their risk tolerance and the degree of control they wish to exert over the financial statements.
Vertical Analysis
Vertical analysis is a proportional examination of a financial statement. This analysis is typically applied within a financial statement for a single period and helps understand the relative proportions of account balances. It helps an organization understand the specific contribution of one item to its overall operational activities.
Vertical analysis involves comparing a specific line item in a financial statement to another line item within the same statement. For instance, an organization might analyze the relationship between cash and total assets in the current year. This enables the organization to determine the percentage of cash (the specified line item) relative to total assets (the other line item) for the given period.
How to conduct a vertical analysis
To conduct vertical analysis, each line item is calculated as a percentage of another item. For instance, on a statement of activities, each line item could be expressed as a percentage of total revenue, while on the statement of financial position, each line item could be presented as a percentage of total assets. These percentages are classified as common-size, as they eliminate size-related fluctuations, enabling comparability among businesses within the industry.
The line item established at 100% serves as the base amount, while the comparison line item is regarded as the comparison amount. The formula for calculating the common-size percentage is as follows:
Common Size Percentage = (Comparison amount / Base Amount) x 100
For instance, In the table below, you can see a sample of the Statement of Financial Positions of two companies. On the left side, the amounts are presented in dollars, while on the right side, they are displayed using vertical analysis as a percentage of total assets, enabling a more direct comparison between Gilavar LLC and Hazri Inc.
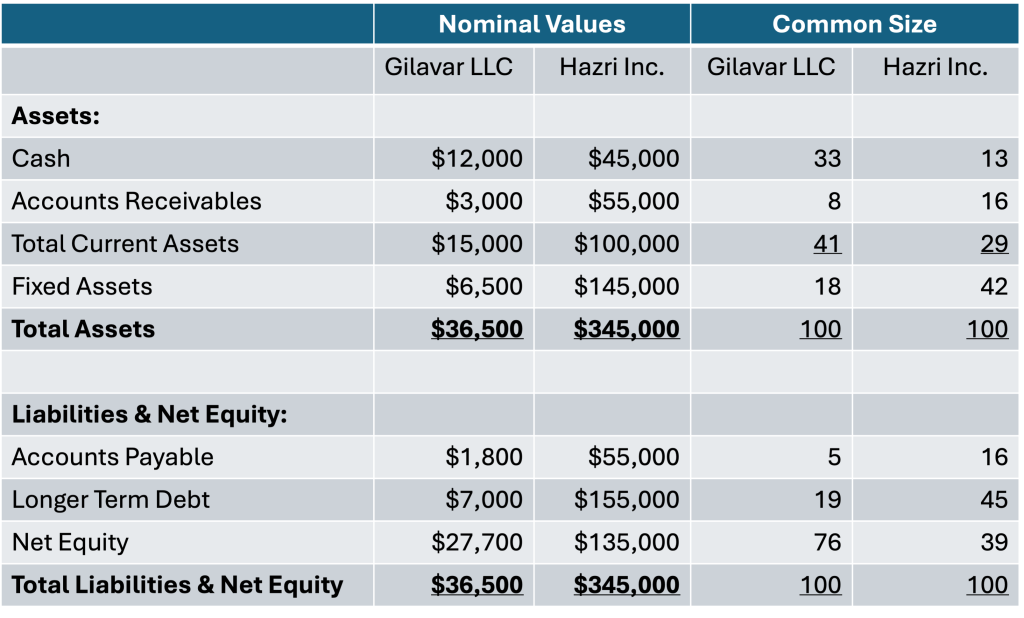
To demonstrate the calculations, let's examine the Cash position of Gilavar LLC. The total Cash is $12,000, and the Total Assets amount to $36,500. The common size of Cash for Gilavar LLC is 33, calculated as follows: ( $12,000 / $36,500 ) x 100.
This analysis is highly valuable for benchmarking against other companies or gaining insights into the relative proportions of each line item.
More advice on reading and preparing financial statements
In the upcoming series, we will delve into the analysis of both the Statement of Financial Position and Income Statements, providing a more comprehensive understanding of financial statements and their intricacies. Stay tuned for insights into dissecting these crucial financial documents.
~Imran Babayev, CPA
The Consonance Group provides expert level financial management for small non-profits and for-profit organizations. Please reach out to Jonathan at jonathan@consonance.group.